
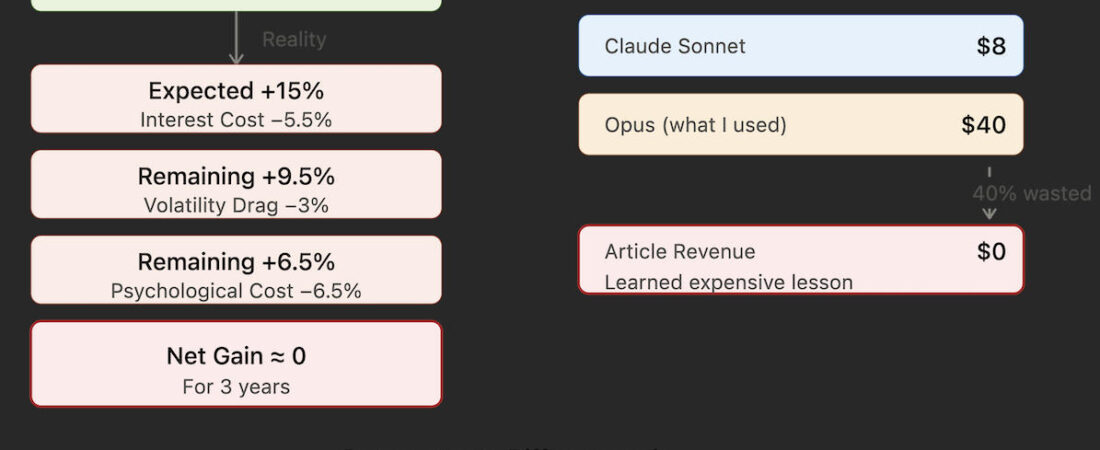
I have used margin in my brokerage account, on and off, for about three years. My reasoning was the sentence every retail investor has heard: moderate leverage increases returns.
I never checked it. Not once. I checked the companies I bought — cash flow, margins, competitive position, all of it. But the leverage sitting underneath those positions, I accepted on faith, because it sounded obviously true. If my portfolio returns more than the interest I pay, borrowing must add something. Right?
Last week I finally sat down with an AI assistant and asked it to do the arithmetic. Not to predict the market. Not to tell me what to buy. Just to compute what my leverage was actually contributing.
It took about ten minutes. The answer was approximately zero, and once I put in a realistic volatility number for my own portfolio, it turned negative.
What the numbers actually said:
| Leverage contribution (3 years running margin) | ≈ zero |
| Net gain from the one tracked margin trade | ¥858 |
| AI session to figure all this out (Opus) | $40 |
That’s when I realized I wasn’t optimizing my investments. I was optimizing spreadsheets.
Here is the whole calculation, in the order it destroyed my assumption.
Is Leverage Worth It for Long-Term Investors? Layer 1: My own safety rule had already capped the upside
I have a personal red line: my maintenance margin ratio must stay above 1000%. I set it because I never want to be anywhere near a forced liquidation.
What I had never done is work out what that rule implies about how much I can actually borrow.
The maintenance ratio is (equity + debt) / debt. For that to stay above 1000%, debt has to be no more than one ninth of my equity — about 11%.
That single line reframed the entire question. I wasn’t asking “does leverage help?” I was asking “does 11% leverage help?” Those are very different questions, and I had been debating the first one for three years while actually living inside the second.
Worth noting: this is generic arithmetic, not something specific to me. If you have a maintenance-ratio rule you consider safe, it already determines your maximum borrowing. Most people set the safety rule and the borrowing amount independently, and never notice the first one has already decided the second.
Layer 2: The interest spread — the only layer most of us compute
The contribution from leverage is: borrowing ratio × (portfolio return − borrowing cost).
Margin rates in my market currently run roughly 5–8%, negotiable lower for larger accounts. Call it 5.5%. At 11% leverage:
| Portfolio return | Leverage contributes |
|---|---|
| +25% | +2.17% |
| +20% | +1.61% |
| +15% (my target) | +1.06% |
| +10% | +0.50% |
| +5% | −0.06% |
| 0% | −0.61% |
| −20% | −2.83% |
| −35% | −4.50% |
So in a good year, leverage buys me about one percentage point. In a bad year it costs me three or four.
At this point I was already less enthusiastic, but not yet convinced I was wrong. One point a year compounds. Fine.
Then came the layer I had genuinely never thought about.
Layer 3: Volatility drag, and why it is the whole ballgame
Your compound return is not your average return. It is roughly:
g = μ − σ² / 2
where μ is your expected return and σ is your volatility. The gap between the two is the “volatility drag,” and it is why a portfolio that gains 50% then loses 33% is flat rather than up 17%.
Here is the part that got me: leverage scales your volatility linearly, but volatility is punished by its square. Borrow 11% more, and your σ goes up 11% — but the drag term goes up by more than that.
At a 15% expected return:
| Volatility | Unlevered compound | With 11% leverage | Difference |
|---|---|---|---|
| 25% | 11.88% | 12.20% | +0.32% |
| 30% | 10.50% | 10.50% | ±0.00% |
| 35% | 8.88% | 8.49% | −0.38% |
| 40% | 7.00% | 6.18% | −0.82% |
At 30% volatility, the benefit and the drag cancel out exactly. Above that, leverage is a slow leak.
| What leverage promises | What actually happened |
|---|---|
| Expected return ↑ | Interest cost ↑ |
| AI analysis cost ↑ ($40) | |
| Holding patience ↓ | |
| Net gain: meaningful | Net gain: ≈ 0 |
So what is my volatility? I hold a concentrated portfolio. My largest single position is over 20% of my capital. Roughly 29% of my market value sits in cyclical businesses. One of my core holdings fell 16% in a single day last month on a news event. A portfolio built like that is not a 25% volatility portfolio. It is comfortably 30–40%.
Which means my leverage has been contributing somewhere between nothing and a small ongoing loss. For three years. While I felt clever about it.
The Kelly criterion says the same thing from another angle. Optimal total exposure is (μ − i) / σ². Plug in a 15% expected return, 5.5% cost, and 30% volatility, and you get 105.6% — meaning optimal debt is about 5.6% of equity, half of what my “conservative” rule permits. At 35% volatility you get 77.6%, which is the mathematics politely telling me I should be holding cash rather than borrowing. And Kelly is famously too aggressive for real humans; practitioners typically use half of it.
Layer 4: My own records, which settled it
Numbers from a textbook can be argued with. Numbers from your own account cannot.
I keep a structured log of every position: why I bought it, what would prove me wrong, every adjustment and the reason for it. When we sorted my positions into two groups — the ones that went through my full written buy process, and the ones I bought in a small “exception bucket” I’d created for quick ideas — the result was:
- Positions that followed the process: +20.9%
- Positions in the exception bucket: −8.5%
Every position I regret is in the second group. And so was the only genuinely margin-funded trade I have made recently.
That trade: I bought on Wednesday using borrowed money. Six days later I sold, spooked by a news report about a draft regulation that had not been published and that the company itself said it could not comment on. My own pre-written rule for that position said hold medium-term.
Gross gain: about ¥1,034. After interest, stamp duty and commission: ¥858.
Eight hundred and fifty-eight yuan, for breaking a rule I had spent a year designing.
And that is where the real cost of leverage finally became visible to me. It was never the 5.5% interest. It was that borrowed money shortened the amount of time I could tolerate being uncertain. My entire edge — the +20.9% group — comes from holding things through discomfort. Leverage systematically converts me from the investor who holds into the investor who flinches.
The Irony
I paid $40 to learn that saving 0.5% on financing cost wasn’t worth obsessing over. The AI bill was larger than the optimization I had been chasing for three years.
| AI tool | Cost | What I got |
|---|---|---|
| GPT-4o | ~$2 | Quick sanity check |
| Claude Sonnet | ~$8 | Detailed walkthrough |
| Claude Opus | $40 | What I actually used |
| Article revenue | $0 | This post |
I chose the most expensive AI to analyze whether I was chasing low-yield gains. The meta-irony arrived with the invoice.
What I actually changed
Not what you’d expect.
I did not revert my leverage rule. I’d already amended my own red lines twice in a short period, both times under pressure, both times in the direction of what I wanted to do anyway. Changing a rule a third time — even toward safety — would reinforce the deeper bug: that my rules are negotiable when I’m emotional.
Instead I added two constraints:
- A rule-change clause. Any modification to a red line requires: 90 days since the last change, a written statement of what protection I’m giving up, and it cannot be done on a day I traded. The point is to make rule changes happen on my calmest day rather than my worst one.
- A restriction on what leverage may be used for. If borrowed money exists in my account at all, it may only fund adding to my most stable, longest-held positions. Never a new position, never the exception bucket, never anything I expect to hold under twelve months. That confines leverage to the one mode where my track record is actually good.
The part about AI that’s worth saying plainly
The AI did not know anything about the market that I don’t. It had no opinion about whether stocks go up. It did not tell me what to buy or sell, and I would not have listened if it had.
What it did was arithmetic I was fully capable of doing myself and had simply never done, because I was emotionally invested in the story and the story felt sufficient. “Moderate leverage increases returns” is a sentence. g = μ − σ²/2 is a test. I had spent three years living inside the sentence.
Does AI improve investing returns?
In my case, not directly. The AI found no better stocks. It found a belief I had been too comfortable to challenge. The return improvement, if any, comes later — from the decisions I no longer make on borrowed conviction.
How much does Claude Opus actually cost?
For a focused analytical session like this one: $40. That’s not a small number for a task that a cheaper model could handle almost as well. I chose Opus out of habit — a vague sense that more expensive meant more rigorous. I had just finished deriving exactly why that kind of reasoning is wrong.
When is Opus worth paying for?
Probably not for straightforward financial arithmetic. Where the cost difference pays off is in nuanced reasoning under ambiguity — evaluating competing frameworks, catching subtle inconsistencies in a long argument. Checking whether your leverage math works is not that task.
Is leverage worth it for long-term investors?
For most individual investors with concentrated portfolios: probably not at the level that feels safe. The 30% volatility break-even in the table above is lower than the actual volatility of most stock-pickers who consider themselves conservative. Run the numbers with your own broker’s rate and your own portfolio’s drawdown history before assuming the spread works in your favor.
The AI didn’t convince me that leverage was mathematically wrong.
It convinced me that leverage wasn’t improving my investing.
Those are not the same thing. You can run the numbers correctly and still be asking the wrong question. I spent three years asking “does leverage increase returns?” The right question was: does leverage improve my investment system?
For me, the answer was no. Not because of the 5.5% interest. Because of what it did to my patience — the one thing my actual track record depends on.
Expensive tools don’t destroy returns. Using expensive tools without measuring their ROI does.
Mine cost me three years and taught me for ¥858. That’s cheap tuition. I’ve paid much worse.
I’m an individual investor writing about my own account. Nothing here is investment advice, and none of it is a recommendation about any security. The interest rate and volatility figures are assumptions used for illustration — run them again with your own broker’s rate and your own portfolio’s drawdown history, because the conclusion is extremely sensitive to both.
Leave a Reply